Did Canada Really Dodge a Housing Meltdown? What the 20% Price Drop Means for GTA Buyers, Renewals and Self-Employed Borrowers (2026)
IndiBrick Editorial
IndiBrick Financial
By Mudit Chhura | Co-Founder, IndiBrick | Read Time: 10 Mins
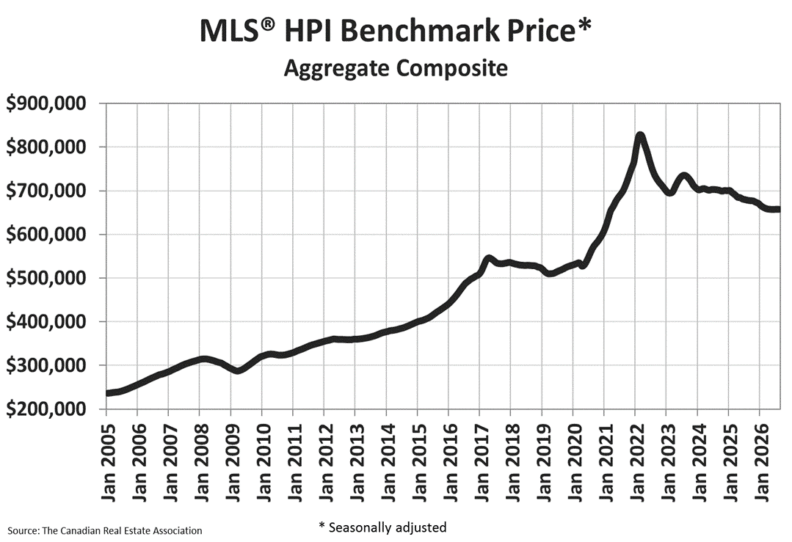
Canadian home prices have fallen roughly 20 percent from their peak. In most countries, a drop that size would have taken the economy down with it. In Canada, it has not. Growth has held up, the banking system has stayed stable, and there has been no wave of forced sales.
That is the central point in a recent Financial Post Posthaste column by Pamela Heaven, drawing on a report from BMO chief economist Douglas Porter, who calls it the "Great Housing Houdini Act." The column also asks a tougher question: did Canada really dodge the damage, or did it just show up somewhere else? For anyone asking whether the Canadian housing market is going to crash, the answer so far is that it corrected sharply but did not melt down, with some caveats worth understanding.
This guide explains what happened, why Canada avoided the worst, where the correction is still playing out in the Greater Toronto Area, and what it means if you are a first-time buyer, a newcomer to Canada, a homeowner facing renewal, or a self-employed borrower. You can check your affordability with our free calculator at any point while you read.
Quick Answer: Is the Canadian Housing Market Going to Crash?
Canada has already had a major price correction, with national prices down roughly 20 percent from their peak, but it has avoided a 2008-style meltdown. BMO's Douglas Porter credits large household wealth, an older population with steadier spending, and a post-pandemic population boom. Real GDP has grown about 1.7 percent annualized since prices began falling, although GDP per person fell more than 2 percent peak to trough in 2022 and 2023. Risks remain, including trade tensions and possible rate increases, so the smart approach is to know your real numbers instead of waiting for a perfect signal.
Canada's Housing Correction by the Numbers
| Indicator | Latest Reading |
|---|---|
| Canadian home prices, decline from peak | Roughly 20% from peak (BMO via Financial Post) |
| US home prices, decline 2006 to 2012 | About 26% (BMO) |
| Real GDP growth since prices started falling | 1.7% annualized vs about 2% century average (BMO) |
| Household net worth as a share of income | About 1,021%, more than double 1990 (BMO) |
| Canadians aged 65+, share of population and of consumption | About 20% of population (12% in 2000), 22.4% of consumption (BMO) |
| Real GDP per capita, 2022 to 2023 | Fell in 4 of 5 quarters, more than 2% peak to trough (BMO) |
| GTA average selling price, September 2026 | $1,006,409, down 5.1% from a year earlier |
| GTA MLS Home Price Index benchmark, September 2026 | $917,600, down 4.7% year over year |
| GTA condo apartment average price, September 2026 | $605,257, down 7.7% |
| GTA home sales, September 2026 | 5,040, down 9% year over year |
| GTA new listings, September 2026 | 16,500, down 14.4% year over year |
| Bank of Canada policy rate | 2.25% |
Sources: Financial Post (Pamela Heaven, Posthaste, Oct 13, 2026) citing BMO Capital Markets (Douglas Porter), Toronto Regional Real Estate Board (TRREB) Market Watch September 2026, Bank of Canada.
The comparison that matters most is the second row. The roughly 26 percent decline in US home prices between 2006 and 2012 triggered a financial crisis and recession. Canada's drop of about 20 percent is not far behind in size, yet Canadian growth has stayed positive throughout.
Why Canada Avoided a Housing Meltdown: The "Great Housing Houdini Act"
BMO chief economist Douglas Porter calls Canada's escape the "Great Housing Houdini Act." In his recent report, he points to three buffers that kept a correction of this size from becoming a crisis.
1. Household wealth is a huge cushion
Canadians carry heavy mortgage and consumer debt, but Porter notes that "the other side of the balance sheet is much larger." With the rapid rise in financial assets, household net worth as a share of income has more than doubled since 1990, to about 1,021 percent. That large stock of wealth helps households keep spending when shocks hit, which smooths the economy through the cycle.
2. An older population spends more steadily
Retirees tend to be less sensitive to economic cycles, and their spending is more stable and predictable. The share of Canadians over 65 has climbed from just over 12 percent in 2000 to about 20 percent today, and that group accounts for roughly 22.4 percent of consumption.
3. The post-pandemic population boom supported spending
Rapid population growth after the pandemic added demand just as interest rates were climbing. More people meant more spending, which made the economy look like it was ticking along fine even as home prices fell. Population growth has since slowed, which matters for the outlook.
Other Factors Often Cited
Other commentary on the correction points to how abruptly prices ran up to the early 2022 peak, the fact that the declines were concentrated in Ontario and British Columbia rather than spread across the whole country, and the mortgage stress test, which required borrowers to qualify at a higher rate than they actually paid. These are widely discussed explanations, but the numbers above are the core of the BMO case.
But Did Canada Really Dodge the Damage? The Per-Capita Problem
The Financial Post's Pamela Heaven asks a sharper question in her Posthaste column: did Canada really avoid the collateral damage, or just hide it? The answer is "maybe not," and the evidence is in the per-person numbers.
Between 2022 and 2023, when inflation was soaring, rates were rising and housing was correcting, real GDP per capita fell in four of five quarters. The peak-to-trough drop was more than 2 percent. Headline GDP held up largely because the population was growing quickly, not because each person was producing or earning more.
For buyers and homeowners, this is the real takeaway. The economy avoided a collapse, but many households have felt the squeeze through higher payments, slower income growth and tighter budgets. That is why knowing your own numbers matters more than any national headline.
See What You Could Qualify For Today
Run your numbers against current rules and rates in a few minutes, free and with no obligation.
Check Your AffordabilityCanada vs the US Housing Crash: A Quick Comparison
| Factor | Canada (2022 to now) | US (2006 to 2012) |
|---|---|---|
| Cumulative price decline | Roughly 20% | About 26% |
| Where the decline hit | Concentrated in Ontario and BC | Broad across the national market |
| Economic impact | Real GDP growth about 1.7% annualized (2% century average) | Triggered a financial crisis and recession |
| Financial wealth buffer and stability | Widespread weak lending | Widespread weak lending |
What the Correction Looks Like in the GTA Right Now
The GTA is one of the two regions where the correction has been concentrated, and the September data shows a market that is still adjusting but showing signs of tightening.
- The average price was $1,006,409 in September, down 5.1% year over year, and the typical home price benchmark was down 4.7%
- Condo apartments saw the steepest decline, with the average down 7.7%, reflecting the large supply of condos available for sale
- Sales fell 9% as buyers waited on clearer signals about jobs, inflation and borrowing costs
- New listings fell 14.4%, which means choice is tightening even though prices are lower than a year ago
- Local conditions vary: the City of Toronto, Peel Region and York Region were reported as buyer's markets, while Halton and Durham were more balanced
TRREB has also pointed to substantial pent-up demand, with many households intending to buy in the months ahead. If buyers return while listings keep falling, price growth could come back. That is the key tension in today's market: lower prices than a year ago, but a supply picture that could change quickly. If you are a first-timer or new to Canada, speak with an IndiBrick advisor and we will walk you through the programs and steps that apply to you.
Avoiding a Meltdown Does Not Mean Avoiding Risk
It is worth being honest about what could still go wrong. Canada escaped a housing-led recession, but several pressures remain.
- Trade tensions: the US-Canada tariff dispute has escalated, and the Bank of Canada governor has warned that fourth-quarter growth could be roughly cut in half if the latest tariffs remain in place
- Interest rates: inflation is at the top of the Bank's target range, and markets are debating whether the next move is a hike, with decisions scheduled for October 28 and December 9
- Renewals: homeowners renewing into higher payments are feeling real pressure, and mortgage delinquencies have been rising in the Toronto area
- Regional gaps: Ontario and BC remain the soft spots, so what is true nationally may not match what you see locally
What This Means for You
If you are a first-time buyer or new to Canada
Prices are lower than a year ago, there is more negotiating room in many segments, and programs for first-time buyers and newcomers are strong. The risk of waiting is that listings are falling and rates could rise. A pre-approval with a rate hold lets you shop with certainty while you decide.
If you are a homeowner facing renewal
Start the conversation early, compare more than one lender, and stress test your budget for a higher payment. Shopping the market at renewal is one of the simplest ways to protect your cash flow. You can see today's lowest mortgage rates on our rates page.
If you are self-employed or an investor
Income that does not look like a standard T4 is exactly where a single bank's approval box can fall short. Brokers can access lenders that assess income through business documents and bank statements, and can structure financing for purchases, refinances and rental properties. Keep your documentation current, since lenders tend to look harder in uncertain markets.
Check Today's Lowest Rates
Compare current fixed and variable options before you decide.
View Today's RatesFive Practical Steps in a Correcting Market
- Know your real budget. Use the affordability calculator and include closing costs.
- Get pre-approved and hold your rate. This protects you if rates rise while you shop.
- Focus on the local market, not the national headline. Conditions differ between Toronto, Peel, York, Halton and Durham.
- Stress test your own budget. Make sure you could handle a higher payment at renewal.
- Work with one coordinated team. Your mortgage advisor, realtor and lawyer should be on the same plan, which is how we work at IndiBrick.
Frequently Asked Questions
Is the Canadian housing market going to crash?
A crash on the scale of the US in 2008 now looks unlikely. Canadian prices have already corrected by roughly 20 percent from their peak without a recession. Risks remain, including trade tensions, higher rates and weak per-person economic growth, but the system has so far shown resilience.
How much have Canadian home prices fallen since 2022?
Canadian home prices have fallen roughly 20 percent from their peak, according to Financial Post reporting on BMO research, with other estimates putting the cumulative decline slightly higher. Prices are still drifting lower in some regions, especially in Ontario and British Columbia.
Why did Canada avoid a housing crash like the US in 2008?
BMO chief economist Douglas Porter points to three main buffers: household net worth that has risen to about 1,021 percent of income, an older population whose spending is more stable, and a post-pandemic population boom that supported spending as rates climbed. He calls the result the "Great Housing Houdini Act."
Did the housing correction really have no economic impact in Canada?
Not entirely. Real GDP has grown at about a 1.7 percent annualized pace since prices began falling, just under the 2 percent average this century. But between 2022 and 2023, real GDP per capita fell in four of five quarters, by more than 2 percent from peak to trough, so the per-person picture was weaker than the headline number.
What are GTA home prices doing right now?
According to TRREB, the GTA average price was $1,006,409 in September 2026, down 5.1 percent year over year, while the typical home price benchmark was down 4.7 percent. New listings fell 14.4 percent, so inventory is tightening.
Is now a good time to buy a house in Toronto or the GTA?
It depends on your finances and plans, but lower prices than a year ago, more negotiating room and strong buyer programs make it worth evaluating. Falling listings and possible rate increases are reasons not to wait indefinitely. An advisor can show you where you stand.
What is the mortgage stress test?
The stress test requires borrowers to qualify at a higher interest rate than the rate they will actually pay, to prove they could handle higher payments if rates rose. It is often cited as one reason Canadian mortgage borrowers have held up, although it is not the main driver in the BMO analysis above.
Will mortgage rates go up in Canada?
It is not certain. The Bank of Canada has held its policy rate at 2.25 percent, but inflation is at the top of its target range and markets are debating a possible hike. The next decisions are October 28 and December 9, 2026.
Should I use a mortgage broker in a correcting market?
A broker can compare multiple lenders, help you hold a rate, and find options if your income or situation does not fit a single bank's approval box. Speak with an IndiBrick advisor for a clear picture of your options.
The Bottom Line
Canada took one of the largest housing corrections in its modern history, with prices down roughly 20 percent, and kept its economy growing. Household wealth, an older population and a post-pandemic population boom did much of the work, which is a stronger explanation than luck, but also a reminder that those cushions are not unlimited.
Avoiding a meltdown is not the same as avoiding uncertainty. Per-person output has been weaker than the headline GDP number suggests, prices are lower, listings are tightening, and rates could move. The most useful thing you can do today is replace guesses with numbers: find out what you can afford, check today's rates, and talk to a team that works together from mortgage to realtor to lawyer.
Make Your Next Move With Real Numbers
Buying, renewing or refinancing, get clear advice from one coordinated team.
Speak to an Advisor Try the Calculator View Today's RatesCommentary draws on the Financial Post and BMO analysis named above; market figures are from the sources named above and change monthly. Rates and program details are subject to change and qualification. This article is general information and not financial, tax or legal advice.
Mortgage Payment Scenarios
Model your monthly payments at different rates.
1. Purchase Details
2. Mortgage Details
3. Property & Closing
Your Monthly Payment
$3,251
Monthly Breakdown (Est)
Stress Test Qualification
To qualify for this mortgage at the 6.29% stress test benchmark, you will need an approximate household income of $140,358 / year.
About the author
IndiBrick Editorial
IndiBrick Editorial Team
Written and fact-checked by the IndiBrick editorial team. Mortgages are brokered through Pineapple Financial Inc. (FSRA #12830).
Related analysis

Mortgage
Is Now the Best Time to Buy Your First Home in the GTA? A Guide for First-Time Buyers and Newcomers to Canada (2026)

Mortgage
Fixed vs Variable Mortgage Rates in Canada: Will the Bank of Canada Raise Rates? (October 2026)

Mortgage
Bank of Canada Warns Tariffs Could Slash Q4 Growth in Half, And Toronto Delinquencies Are Already Rising
Ready to act?
Turn this insight into a funded deal.
Book Call